
Google Analytics Blog
The Bottom of the List
December 10, 2025
In addition to tracking the effectiveness of web-based promotions, Google Analytics is useful for general housekeeping tasks like finding pages cluttering your analytics numbers (logged-in and 404 errors) and pages that are public but really should be private. Once you clear away those items and set rules in place to keep them out of your analytics, you can examine which of your pages are necessary, findable, and in demand.
Pages without views
From the launch of our Drupal 10 redesign website August 1 2024 to the latest date of reporting, November 24, 2025, only six pages have not been looked at by a single user, including their owners. Three of them are personal pages, but the others point to cleanup tasks or a need to promote (URLS are truncated at the site root to prevent Google indexing):
about/history/delmar-oviatt
This page is linked nowhere and should probably be removed since this person's name has been disassociated from the building.
collections/ctva-collection-development
collections/theatre-collection-development
These pages are also linked nowhere, although we do have a general Collection Development page where they could be linked.
Pages with VERY few eyeballs on them
Linking and deleting pages is simple enough. What about pages that get little traffic? Another way of measuring traffic is to look at the number of active users that have visited them. Our "active users" count includes public and CSUN users, as well as library staff and faculty, including systems administration staff. While there are several methods for Excluding Internal Traffic from GA4, our use case doesn't fit: one solution requires static IP addresses, and the others would require all in internal users to take extra steps to access the website, which just isn't practical. Therefore, ALL users are included in our stats.
Pages with 1-2 active users
Let's start at the bottom. During that same almost-15-month period, 555 pages were seen by only 1 or 2 active users. Of these, 459 were legacy items we would not expect to be visited frequently, such as past events pages, Enews issues, and blog posts. Three were personal pages. Another 23 were pages that really weren't intended for public viewing, and 36 were pages that redirected to similar URLs.
That left these 34:
| Page, document or group of documents | Explanation |
|---|---|
| sites/default/files/uploads/map-collection/documents/x660.pdf sites/default/files/uploads/map-collection/documents/t731_southern_half.pdf sites/default/files/uploads/map-collection/documents/m784-7.pdf sites/default/files/uploads/map-collection/documents/m781-3.pdf sites/default/files/uploads/map-collection/documents/l991.pdf map-collection/collections/gov-docs/topos/WY map-collection/collections/gov-docs/topos/WV map-collection/collections/gov-docs/topos/WI map-collection/collections/gov-docs/topos/WA map-collection/collections/gov-docs/topos/UT map-collection/collections/gov-docs/topos/TN map-collection/collections/gov-docs/topos/SD map-collection/collections/gov-docs/topos/OR map-collection/collections/gov-docs/topos/OK map-collection/collections/gov-docs/topos/NV map-collection/collections/gov-docs/topos/NE map-collection/collections/gov-docs/topos/ND map-collection/collections/gov-docs/topos/NC map-collection/collections/gov-docs/topos/MT map-collection/collections/gov-docs/topos/MD map-collection/collections/gov-docs/topos/KS map-collection/collections/gov-docs/topos/IN map-collection/collections/gov-docs/topos/CO map-collection/collections/gov-docs/topos/CA map-collection/collections/gov-docs/topos/AL | All of these Map Collection pages and documents are highly specialized. By contrast, the Map Collection section as a whole had 6,843 active users during that same period. |
| sites/default/files/uploads/bradley-center/documents/Lesson-4-new-250418.pdf bradley-center/who-richard-cross bradley-center/posters bradley-center/collections/juli%C3%A1n-cardona | The Bradley Center only went live on the Library website June 26, 2025, and these pages are not "new" documents. |
| technology/cms/zoom-backgrounds | This page was launched during the pandemic and is not linked anywhere. |
| about/transformation/gallery/during about/transformation/gallery/before | These are historic pages dating originally from about 2013. |
| collections/music-collection-development collections/california-government-documents-development | These pages are kin to the collection development pages above seeing no traffic. |
Pages with 3-20 active users
1,180 pages were seen by only 3-20 users during our almost-15-month period, not all of them Drupal. These include
- 546 Cited at the Library pages and views
- 49 Bradley Center pages (which were only added in June 2025)
- 136 Library Enews stories
- 261 Event pages
- 4 Map Collection pages
- 14 Past Exhibit pages
- 142 Peek-in-the-Stacks pages
- 7 Research Fellow pages
- 5 personal pages
- 4 monograph pages in the Database of Psychological Tests, Instruments, Rating Scales, and Measures app
Here are the numbers for the remaining 12:
| Truncated URLs | Page Views | Active Users |
|---|---|---|
| ealtman/google-analytics | 43 | 14 |
| image-stylesheet | 28 | 9 |
| image-stylesheet-basic | 24 | 7 |
| about/transformation/gallery/opening | 18 | 5 |
| collections/government-documents-development | 17 | 5 |
| wise/about-bonnie-dunbar | 12 | 10 |
| sample-tertiary-body-styles | 11 | 8 |
| wise/tietjen-bio | 11 | 10 |
| sca/services/u100-deed-of-gift | 8 | 4 |
| about/transformation/gallery | 7 | 3 |
| sca/services/u100-oral-history-agreement | 5 | 4 |
| give/endowments/antonio-m-calvo | 3 | 3 |
From this data we can determine whether a page is necessary going forward, and whether more promotion and linking is needed to make it findable.
August 29, 2025
The CSUN campus move to Drupal 10 brought with in a big, bold design with lots of images, videos, whitespace, large fonts, and VERY long pages. We lost our "homepage banner" advertising space to a "hero image" and most of our featured content now falls "below the fold" -- that is, users need to scroll down past the initial screen-height to find it. Are they?
Using Google Analytics,in combination with Google Tag Manager, we are able to measure "scroll depth": how far users scroll into a page. I followed the tutorial How to see Scroll Depth in Google Analytics 4? from AnalyticsMania and was able to set up a custom GA4 view. It shows how many times people scrolled to depths of 25%, 50%, and 75% of the top 25 pages on the website between August 26rd and August 28, 2025. Here is an excerpt.
| Page URL | Percent scrolled | Event count | Total users |
|---|---|---|---|
| https://library.csun.edu | 25 | 2239 | 1455 |
| 50 | 375 | 331 | |
| 75 | 202 | 180 | |
| https://library.csun.edu/technology/dlp | 25 | 1061 | 803 |
| 50 | 561 | 490 | |
| 75 | 370 | 335 | |
| https://library.csun.edu/research-assistance/lib290 | 25 | 582 | 519 |
| 50 | 467 | 434 | |
| 75 | 343 | 319 | |
| https://library.csun.edu/services/study-rooms | 25 | 586 | 442 |
| 50 | 332 | 291 | |
| 75 | 238 | 218 | |
| https://library.csun.edu/hours | 25 | 532 | 439 |
| 50 | 404 | 349 | |
| 75 | 157 | 147 | |
| https://library.csun.edu/technology/printing | 25 | 278 | 234 |
| 50 | 183 | 166 | |
| 75 | 105 | 98 | |
| https://library.csun.edu/services/borrow-renew-return | 25 | 235 | 180 |
| 50 | 215 | 170 | |
| 75 | 73 | 69 | |
| https://library.csun.edu/services/library-for-students | 25 | 273 | 223 |
| 50 | 119 | 108 | |
| 75 | 64 | 60 | |
| https://library.csun.edu/collections/scholarworks | 25 | 138 | 123 |
| 50 | 108 | 101 | |
| 75 | 89 | 83 | |
| https://library.csun.edu/about/building-floor-maps | 25 | 177 | 145 |
| 50 | 116 | 105 | |
| 75 | 31 | 31 |
Where are you when you've scrolled 50% down a page? That depends on the size of your screen, your viewport. Here's a comparison of what users see on phone and desktop when scrolling to different depths on the University Library Homepage:
| Depth | Desktop | Mobile |
| 25% |  | 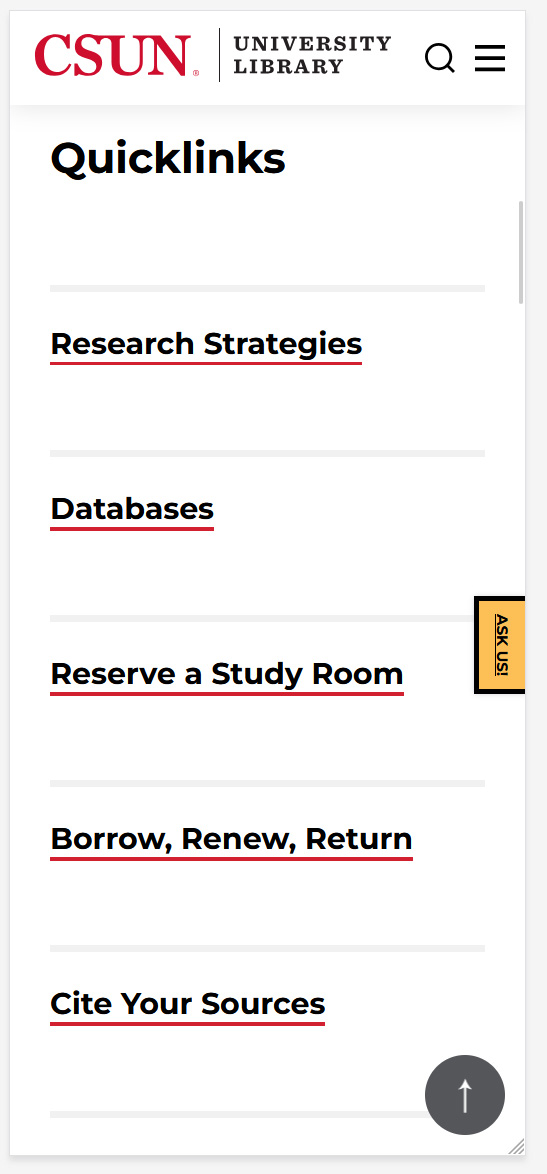 |
| 50% |  |  |
| 75% | 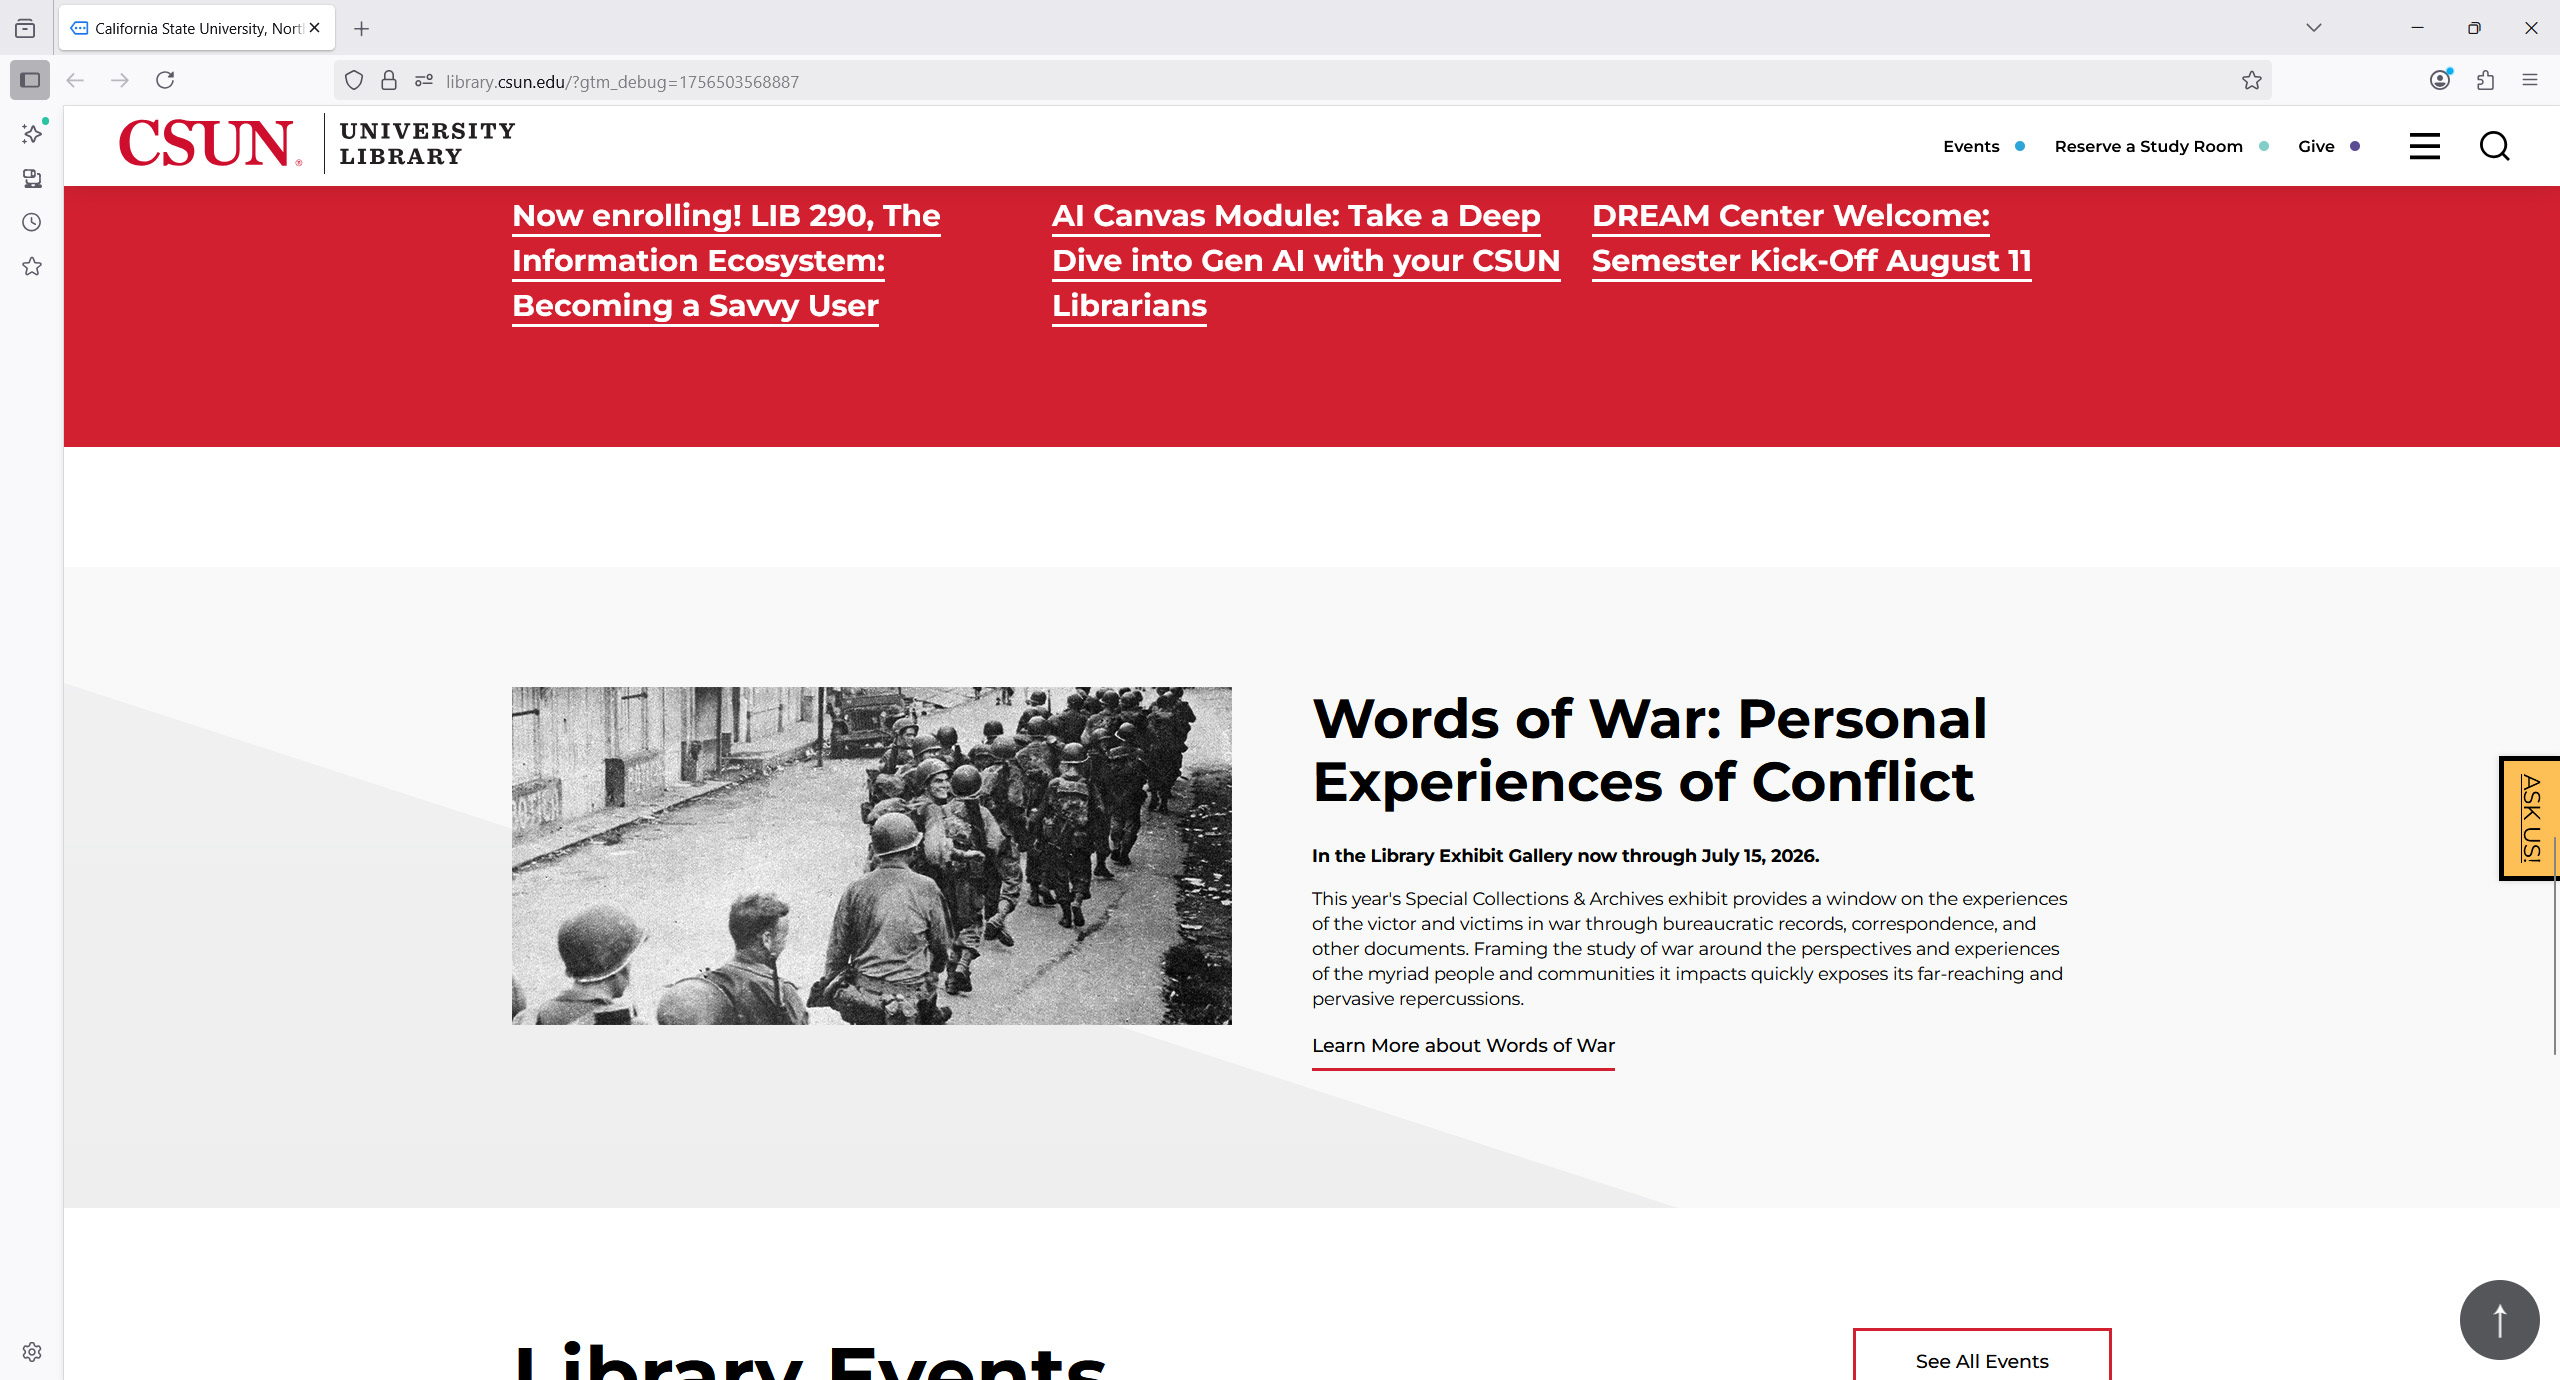 |  |
These views were derived using Google Tag Manager in preview mode, which allows you to see the tags fire in real-time. The phone experience was approximated using Firefox DevTools.
September 29, 2025
I would like to run some tests on my website, and I would like that test to impact as few users as possible. Although GA4 gives you daily engagement numbers out of the box, you need to go into Explore to create a custom report to look at users-per-hour. The testing takes 24 hours, so I need to find a lower-traffic 24 hour block. To do that I improvised on the tutorial on How to View GA4 Hourly Traffic Report. Rather than use all the standard traffic metrics, I opted to focus just on Total Users (which includes Active Users and New Users), and I only measured for two weeks, because GA4 puts a limit on how much data you can view.
The easiest way to view the result was to download a PDF - Hourly Traffic, Two Weeks. The numbers in the first column are date/hour formatted as YYYYMMDDHH (that's 24-hour military time). The two weeks, starting on at 12:00am Friday, show not quite the same pattern, but you can see that traffic drops off off sharply after 12:00am Saturday, and stays relatively low (below 90 users) through Saturday, till it starts tracking up slightly higher on Sunday. Tuesday 10:00am seems to be peak time in both weeks.